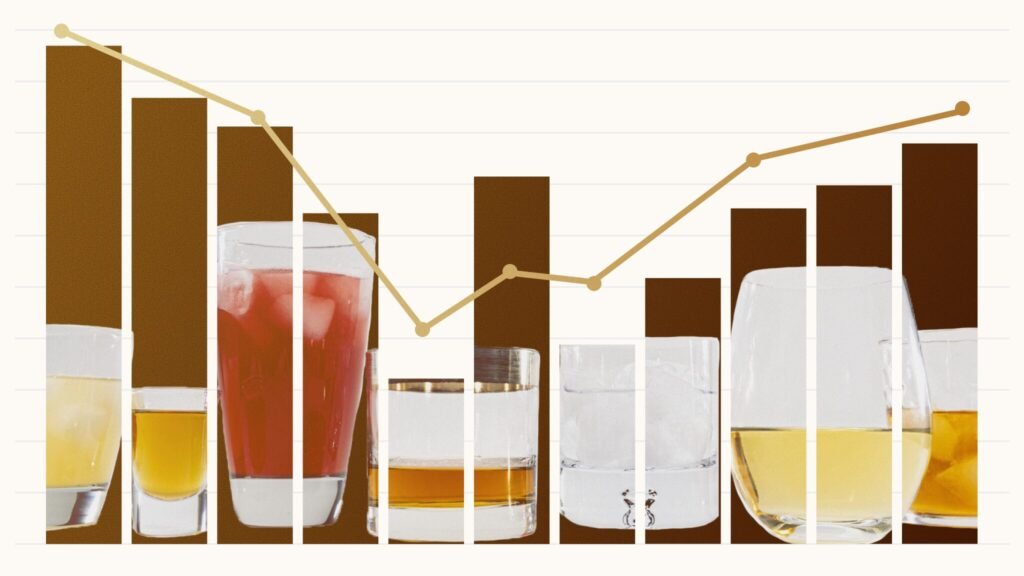
“The Deadliest Drug,” a multipart series by STAT, spotlights an epidemic hidden in plain sight: excessive alcohol use. Alcohol kills more Americans each year than all illicit drugs combined, and yet health officials, industry leaders, and the public rarely focus on it. STAT reporters Isabella Cueto and Lev Facher examined the epidemic’s human cost and the complex causes — from personal to political — of the most harmful substance use crisis in the U.S. STAT data editor J. Emory Parker amplified many of the findings in data-rich charts.
These charts capture the toll, emerging risks, shifting usage, and economic stakes of America’s relationship to alcohol.
1. Alcohol-related emergency department visits nearly doubled in the U.S. between 2003 and 2022
Drinking-related adverse events, including emergency room visits, have soared in recent decades. American emergency rooms recorded roughly 5.4 million visits due to alcohol in 2022, and in many states, alcohol-related hospitalizations dwarf those stemming from other substances, like opioids.